Latest Covid figures for individual areas in Leamington, Warwick and Kenilworth offer signs of encouragement
and live on Freeview channel 276
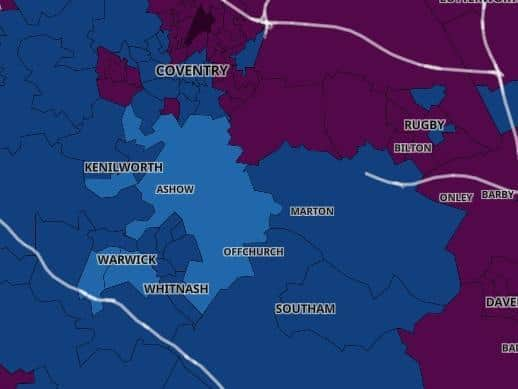
The Warwick district saw a 32 per cent fall in Covid cases, compared to the week before.
And nearly all the wards in the district showed decreases in positive cases, based on the latest Government data covering the seven days to January 13.
Advertisement
Hide AdAdvertisement
Hide AdThere was a decrease for the county as a whole - a 12.5 per cent fall for Warwickshire.

These figures offer a sign of encouragement - and more vaccines are being rolled out across the region.
As we reported last week, over the seven days to January 6 there was a 25 per cent increase in cases in Warwick district - and the district's rolling rate was 383.3 per 100,000 people.
Now the district's rolling rate is 259.5, well below the national average.
Advertisement
Hide AdAdvertisement
Hide AdHere are the figures for the district, county and individual areas.
The figures cover the seven days up to January 13.
Seven day rates are expressed per 100,000 population and are calculated by dividing the seven day count by the area population and multiplying by 100,000.
OVERALL
Warwick district
Seven days to January 13
Total cases: 373
The rate has decreased relative to the previous week by 177 (-32.2%)
Rolling rate: 259.5 (below the national average)
Warwickshire
Seven days to January 13
Total cases: 2,091
The rate has decreased relative to the previous week by 299 (-12.5%)
Rolling rate: 361.8 (below the national average)
LEAMINGTON, LILLINGTON AND WHITNASH
Leamington Central & North
Total cases: 29
Advertisement
Hide AdAdvertisement
Hide AdThe rate has decreased relative to the previous week 19 (-39.6%)
Rolling rate: 212.0
Leamington West & Milverton
Total cases: 23
The rate has decreased relative to the previous week by 29 (-55.8%)
Rolling rate: 238.3
Leamington Brunswick
Total cases: 34
The rate has decreased relative to the previous week by 10 (-22.7%)
Rolling rate: 310.9
Leamington East & Sydenham
Total cases: 40
The rate has increased relative to the previous week by 4 (11.1%)
Rolling rate: 361.0
Lillington
Total cases: 15
Advertisement
Hide AdAdvertisement
Hide AdThe rate has decreased relative to the previous week by 4 (-21.1%)
Rolling rate: 273.8
Whitnash
Total cases: 39
The rate has decreased relative to the previous week by 14 (-26.4%)
Rolling rate: 397.4
WARWICK
Warwick South East, Myton & Heathcote
Total cases: 23
The rate has decreased relative to the previous week by 26 (-53.1%)
Rolling rate: 197.8
Warwick North
Total cases: 28
The rate has increased relative to the previous week by 5 (21.7%)
Rolling rate: 333.0
Warwick South West & Aylesford
Total cases: 24
Advertisement
Hide AdAdvertisement
Hide AdThe rate has decreased relative to the previous week by 16 (-40.0%)
Rolling rate: 190.7
KENILWORTH
Kenilworth West
Total cases: 18
The rate has decreased relative to the previous week by 13 (-41.9%)
Rolling rate: 241.6
Kenilworth East
Total cases: 21
The rate has decreased relative to the previous week by 8 (-27.6%)
Rolling rate: 261.6
Kenilworth South
Total cases: 12
The rate has decreased relative to the previous week by 11 (-47.8%)
Rolling rate: 168.1
RURAL AREAS
Cubbington, Stoneleigh & Radford Semele
Total cases: 23
Advertisement
Hide AdAdvertisement
Hide AdThe rate has decreased relative to the previous week by 19 (-45.2%)
Rolling rate: 177.9
Kingswood & Leek Wootton
Total cases: 13
The rate has decreased relative to the previous week by 15 (-53.6%)
Rolling rate: 248.1
Bishops Tachbrook, Barford & Hatton Park
Total cases: 31
The rate has decreased relative to the previous week by 2 (-6.1%)
Rolling rate: 319.3
Harbury, Long Itchington & Fenny Compton
Total cases: 31
The rate has decreased relative to the previous week by 20 (-39.2%)
Rolling rate: 299.1